
Grasping at Statistical Straws

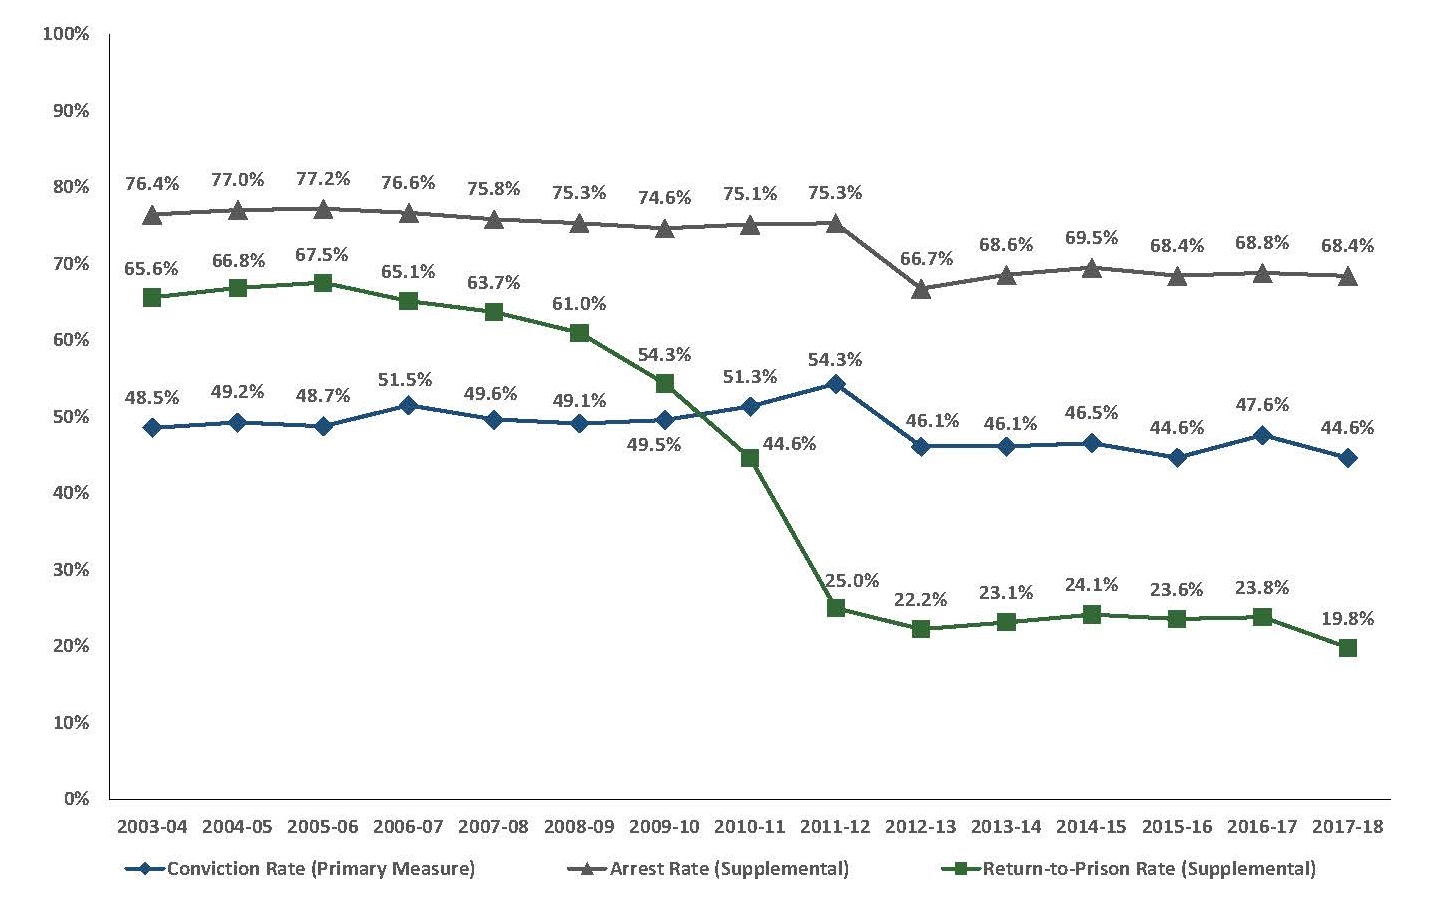
Cal. 3-Year Recidivism Rates for Cohorts Released in 2-Year Periods 2003-2018
This graph shows data on recidivism from the California Dept. of Corrections and Rehabilitation’s most recent report. Each cohort released in a 2-year period is tracked for three years for arrests, convictions, and returns to prison. The blue line is convictions, which CDCR regards as its primary measure. This rate was 44.6% for the 2015-16 cohort. It rose to 47.6% for the 2016-17 cohort. Then for 2017-18 it fell back to where it was for 2015-16. CDCR’s Secretary is crowing that this represents confirmation that post-Prop. 57 “credit-earning opportunities … is [sic] having a positive impact to improve public safety.”
Seriously?
Giving too much weight to minor fluctuations in data is a rookie mistake in analysis of statistics. Crowing about a drop in a recidivism statistic without acknowledging that the drop is merely a give-back of the previous period’s increase is particularly egregious. In addition, there is no explanation for why the fluctuations in convictions are not matched by similar moves in the rates of arrest. The arrest rates for the last five periods are about as close to flat as social statistics get in the real world. If it really was a change in recidivism rather than something else, we would expect these rates to move together, or perhaps together with a time lag.
Further down in the statement is this gem:
Of note, the 2017-18 report begins tracking the impact of the 2016 voter approved measure Proposition 57, which allows for enhanced credit-earning and parole opportunities. While the timing is limited, given Proposition 57 began a phased implementation throughout 2017, the preliminary data shows that half of the people released from prison that year (50.1 percent) earned some type of enhanced credit. The three-year conviction rate for offenders who earned credit (43.8 percent) was slightly lower than the rate for offenders with no enhanced credit earnings (45.4 percent). Additionally, those who earned Educational Merit Credit or Rehabilitative Achievement Credit had notably lower conviction rates (28.9 percent and 22.5 percent, respectively) than those without enhanced credit earning (45.4 percent).
While these are preliminary findings, they show an early positive trend in California’s investments to improve public safety through an increased focus on rehabilitation, education, and restorative justice efforts.
Wow. Talk about rookie mistakes. Comparing two groups of people who are self-selected, not randomly selected, to receive a “treatment” (in the jargon of the trade) and then pronouncing success because the treatment group does better is a textbook example of how not to do a valid study. And an elementary textbook at that.
In common parlance, this is comparing apples and oranges. The people who chose to engage in the education and rehabilitation activities were very likely better candidates for going straight than those who chose not to. There is no valid basis for assuming that the difference in outcomes is the result of the treatment rather than a pre-treatment difference in the self-selected groups.
The CDCR statement does demonstrate something, though. It demonstrates that the head of one of the country’s largest prison systems doesn’t know jack about how to do a valid study. And that is very disturbing.
Here is a larger version of the graph:
On the other hand this shows that claims that Prop 57 would increase crime also seem to be unfounded. So if we are able to reduce sentences, which is better for both government finances and human beings who are not being caged seems like a good thing.
I’m not sure I follow your logic. If the rate of crimes committed per released criminal is steady and the number of released criminals increases, then the number of crimes committed increases, does it not?