
Crime in the United States and California
Some years ago, we began tracking the trends in crime in California versus the country as a whole. California has been more aggressive than most states in the “criminal justice reform” movement, a euphemism for reducing the consequences of crime to criminals. See prior posts on the archive blog here and here. (See tech note below if you have difficulties.)
With the release of the 2022 national crime data (see this post), it seemed like a good time to update the data.

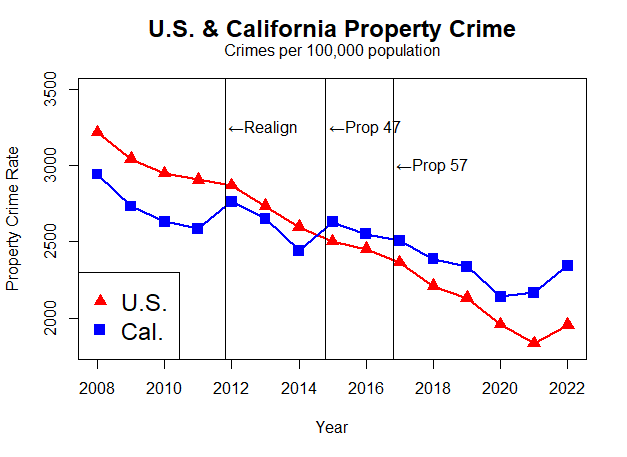
Noted on the graphs are the times of enactment of three major pieces of legislation: (1) the Realignment bill of 2011, which sent a large portion of California felons to county jail instead of state prison, (2) Proposition 47, which reduced many felonies to misdemeanors, and (3) Proposition 57, which reduced time served for many of the felons still in state prison, in some cases drastically. There have been many other bills watering down consequences, but these are the three largest.
California was generally tracking the decline in crime of the country as a whole before this wave of legislation began. The trend in violent crimes had a bump in 2012 and then a sharp divergence from 2015 to the latest available data. The gains since 2008 have been given back in California, while nationally the major declines stopped in 2012, with no clear up or down trend from that year to the present.
For property crime, California has seen a decline overall during this period, but it has not shared as great a decline as the country as a whole. For the last two years, property crime is nearly unchanged in the country as a whole but up nearly 10% in California. The state’s property crime rate was 9% below the national rate in 2008 but now is 20% above it.
These trends are, of course, not proof by themselves of the folly of California’s “reform” policies. There are many factors that go into crime rates, and some other states have also adopted misguided policies. Even so, the divergence from the national trend and especially the sharp increases in the last year cast doubt on the “reformers” assurances that everything is fine and that those of us questioning the changes are engaging in “scare tactics.” A 13% increase in violent crime in two years is alarming by any standard.
——–
These data are downloaded from the FBI’s Crime Data Explorer. The 2021 data need to be viewed with caution due to problems in the transition in methods of counting crimes. See this post. The FBI site notes, “Due to the full transition to NIBRS and the lack of data for agencies that are not fully transitioned, the 2021 data year cannot be added to the 5-, 10- or 20-year trend presentations that are based in traditional methodologies used with summary data.”
Tech Note: The archive blog still runs on old software that does not meet contemporary standards. You may need to disable some protections in your browser to see the archived posts correctly.